Disclosure: This post may contain affiliate links, meaning if you decide to make a purchase through my links I may earn a commission at no additional cost to you. See my disclosure for more info.
Figuring out the size of the prostate is pretty important, especially when doctors are looking for signs of trouble like cancer. For a long time, doctors just sort of guessed based on how things looked. But that’s not always accurate, right? That’s why learning about calculating prostate volume using modern imaging techniques is a big deal. It gives us a much clearer picture and helps in making better decisions about treatment. This guide will walk you through how it’s done, from the basics to some pretty advanced stuff.
Key Takeaways
- Measuring prostate volume accurately is key for assessing prostate health and guiding treatment decisions.
- While older methods relied on guesswork, modern MRI techniques offer precise ways of calculating prostate volume.
- Advanced techniques like radiomics and hybrid MRI are pushing the boundaries of what we can measure and understand about the prostate.
- Standardizing MRI protocols is vital to ensure consistent and reliable prostate volume calculations across different scans and locations.
- Interpreting quantitative MRI data helps doctors compare findings with other tests and predict outcomes like cancer recurrence.
Understanding Prostate Volume Measurement
The Role of Size in Prostate Assessment
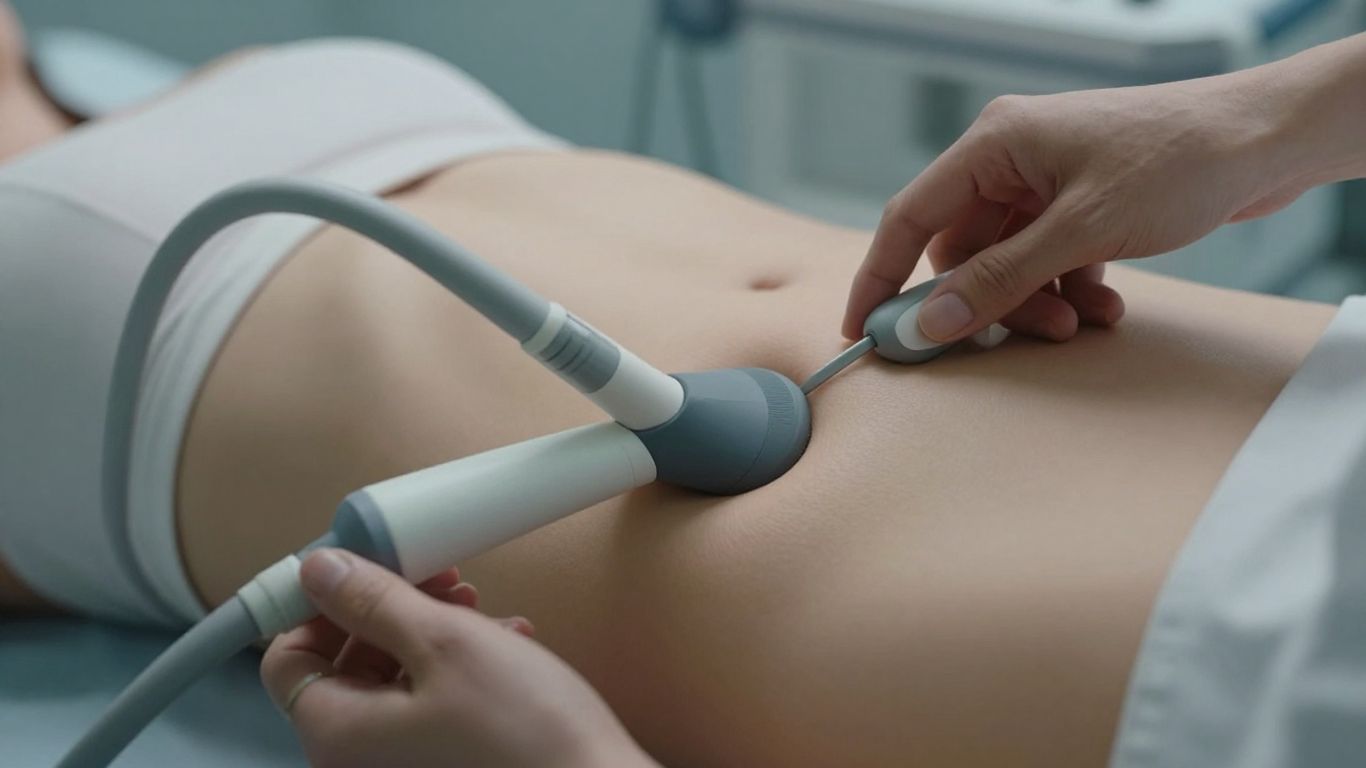
When we talk about the prostate, its size is one of the first things doctors look at. It’s a pretty straightforward measurement, and it’s actually one of the few quantitative bits of info included in the standard guidelines for looking at prostate MRIs. Why does size matter? Well, it can give us a clue about how suspicious a spot might be for cancer. For instance, if a tumor is poking out and touching the capsule surrounding the prostate for more than a centimeter, that’s a sign that it might be spreading outside the gland. This is a big deal.
Explore more NutritionGeeks guides related to wellness, recovery, nutrition and active lifestyle support.
Limitations of Qualitative Measurements
Now, sometimes doctors just look at an image and make a judgment call – that’s a qualitative assessment. They might look at the shape, too, using things like how round it is. But honestly, these visual checks haven’t really proven to be better than just a good old-fashioned description. When you compare what the MRI shows to what they find after surgery, it seems like we often underestimate the actual tumor size, whether we’re guessing or using measurements. It’s not perfect, but the good news is that these methods are pretty decent at predicting if the cancer has spread outside the prostate.
The length of a positive surgical margin, meaning where the cancer was cut out but still shows up at the edge of the removed tissue, has been shown to predict if the cancer will come back after surgery. This is why getting accurate measurements, even if they’re not perfect, is so important.
Helpful Related GuidesMore NutritionGeeks Wellness Guides
Explore more NutritionGeeks guides connected to wellness, recovery, hydration, energy, sleep and active lifestyle nutrition.
Collagen for Joint Health: A Runner’s Complete Guide Adzuki Beans Health Benefits: Your Complete Runner’s Guide Acid vs Alkaline Food: Science-Based Guide Agave vs Stevia: Which Sweetener Actually Fits Your Goals Glycine vs Magnesium Glycinate: What Actually Matters Green Tea Extract vs Matcha: Which Delivers Better Results Super Greens vs Multivitamin: Which Fits Your Goals? Apple Cider Vinegar vs Berberine: Which Actually Works?
The Importance of Accurate Volume Calculation
Getting the volume right is more than just a number. It helps doctors figure out the best way to treat you. If we can get a better handle on the size and spread of the cancer, we can make more informed decisions. This is where quantitative techniques come into play. They aim to provide objective, measurable data, moving beyond just what the eye can see. While there have been challenges in making these measurements consistent across different machines and hospitals, the goal is to have a standardized way to assess the prostate, reducing guesswork and improving patient care. Think of it like this:
- Step 1: Initial imaging to get a general look.
- Step 2: Applying specific quantitative methods to extract detailed data.
- Step 3: Using this data to better understand the prostate’s condition and plan treatment.
This move towards more precise measurements is really about making sure everyone gets the most accurate assessment possible, no matter where they get their scan done.
Quantitative MRI Techniques for Prostate Volume
Diffusion-Weighted Imaging (DWI) and ADC Values
So, we’ve moved beyond just looking at pictures and started measuring things. Diffusion-Weighted Imaging, or DWI, is a big part of this. It basically tracks how water molecules move around in your prostate tissue. Cancerous cells tend to restrict this movement more than healthy cells. The key number we get from DWI is the Apparent Diffusion Coefficient, or ADC. A lower ADC value often suggests a higher likelihood of clinically significant cancer. Think of it like a crowded room versus an empty one; water has a harder time moving through a crowd. We can get a map of these ADC values, and by looking at the average ADC within a suspicious area, we get a quantitative measure. This is way more objective than just saying ‘this area looks dark on the scan.’
Dynamic Contrast-Enhanced (DCE) MRI Parameters
Next up is Dynamic Contrast-Enhanced MRI, or DCE-MRI. Here, we inject a contrast agent into your bloodstream and watch how it travels through the prostate. Different tissues take up and wash out this contrast at different rates. For prostate cancer, we often see a rapid uptake of the contrast agent followed by a relatively quick washout. We can measure parameters like Ktrans (how quickly the contrast moves from the blood into the tissue), Ve (the volume of the extracellular space), and Kep (the rate at which contrast moves from the tissue back into the blood). These numbers give us a picture of the blood flow and the tissue’s structure. It’s like tracking how fast a delivery truck gets to a neighborhood and then leaves. These DCE parameters can help differentiate between cancerous and non-cancerous tissue, and even help predict how aggressive a cancer might be.
T2-Weighted Imaging (T2WI) and Tissue Composition
Even good old T2-weighted imaging (T2WI), which we’ve used for ages to see the prostate’s anatomy, can give us quantitative information. While it’s often interpreted qualitatively (is it bright, dark, or somewhere in between?), we can actually measure the signal intensity and how it changes across different parts of the prostate. Different tissue types have different water content and molecular environments, which affect how they show up on T2WI. For example, the transition zone (where benign prostatic hyperplasia often occurs) and the peripheral zone (where most cancers develop) have distinct T2 signal characteristics. By quantifying these T2 signal intensities, we can get a better handle on the tissue composition and potentially identify areas that are more likely to harbor cancer. It’s not just about seeing the shape; it’s about measuring the ‘brightness’ in a precise way.
Here’s a quick look at what these techniques measure:
- DWI/ADC: Measures water molecule movement; lower ADC often means cancer.
- DCE-MRI: Tracks contrast agent uptake and washout; parameters like Ktrans and Ve show blood flow and tissue characteristics.
- T2WI: Quantifies signal intensity to assess tissue composition and differentiate zones.
While these quantitative methods offer a more objective way to assess the prostate, it’s important to remember that they are still evolving. Standardization across different MRI machines and protocols is key to making sure the numbers we get are reliable and comparable from one scan to the next. We’re getting there, but it’s a work in progress.
Advanced Methods in Calculating Prostate Volume
Beyond the basic measurements, there are some pretty sophisticated ways to get a handle on prostate volume, especially when we’re talking about cancer. These methods go deeper than just looking at size and shape.
Radiomics for Feature Extraction
Radiomics is essentially about pulling out a ton of quantitative data from MRI images that you wouldn’t normally see with the naked eye. Think of it like a super-detailed analysis of the image’s texture, signal intensity differences, and other subtle patterns. These features can help tell the difference between cancerous and healthy tissue. It’s been shown to be pretty good at spotting cancer, sometimes as good as other metrics, and can even help figure out how aggressive the cancer might be.
- Texture analysis: Looking at how pixel values vary within a region.
- Shape analysis: Measuring things like sphericity or compactness.
- Intensity analysis: Quantifying the range and distribution of signal intensities.
It’s important to remember that radiomics relies on pre-processing steps, and how you do those steps can actually change the results you get. So, it’s not just about the MRI itself, but also how you process the data afterwards. This approach is more about analyzing existing images quantitatively rather than a new way to acquire images. It’s a bit like finding hidden clues in the pictures.
Hybrid Multidimensional MRI Approaches
This is where things get really interesting. Instead of relying on just one type of MRI sequence, these methods combine information from several. For example, you might combine data from T2-weighted imaging (which shows anatomy well) with diffusion-weighted imaging (DWI) and dynamic contrast-enhanced (DCE) MRI. By looking at these different data sets together, we can get a more complete picture of the prostate’s tissue characteristics and how they relate to cancer. This multi-faceted view can improve accuracy in volume calculations and cancer detection. It’s like putting together puzzle pieces from different boxes to see the whole image.
Combining different MRI sequences allows us to see the prostate from multiple angles, providing a richer dataset for analysis. This synergy helps overcome the limitations of any single technique, leading to more robust and reliable volume estimations, especially in complex cases.
MR Fingerprinting for Tissue Characterization
MR fingerprinting (MRF) is a newer technique that’s pretty neat. Instead of just taking a snapshot, it uses a series of rapidly changing magnetic fields and radiofrequency pulses. The way the tissue responds to these pulses creates a unique "fingerprint" for different tissue types. This allows for very precise quantitative measurements of tissue properties, like T1 and T2 relaxation times. These measurements can then be used to characterize the tissue composition, helping to distinguish between different types of prostate tissue, including cancer. It’s a bit like identifying someone by their unique fingerprint. This method has shown promise in correlating with the actual tissue makeup seen in pathology slides, offering a detailed look at the prostate’s internal structure. The ability to get these detailed tissue properties could really help refine how we calculate prostate volume and understand the tissue better. It’s a step towards more personalized imaging. For example, understanding the prostate-specific antigen density (PSAD) is important, and MRF might offer a more precise way to get the prostate volume needed for that calculation Serum total PSA (tPSA).
These advanced methods are pushing the boundaries of what we can learn from prostate MRI, moving beyond simple measurements to a more detailed, quantitative understanding of the prostate.
Standardizing Prostate MRI Protocols
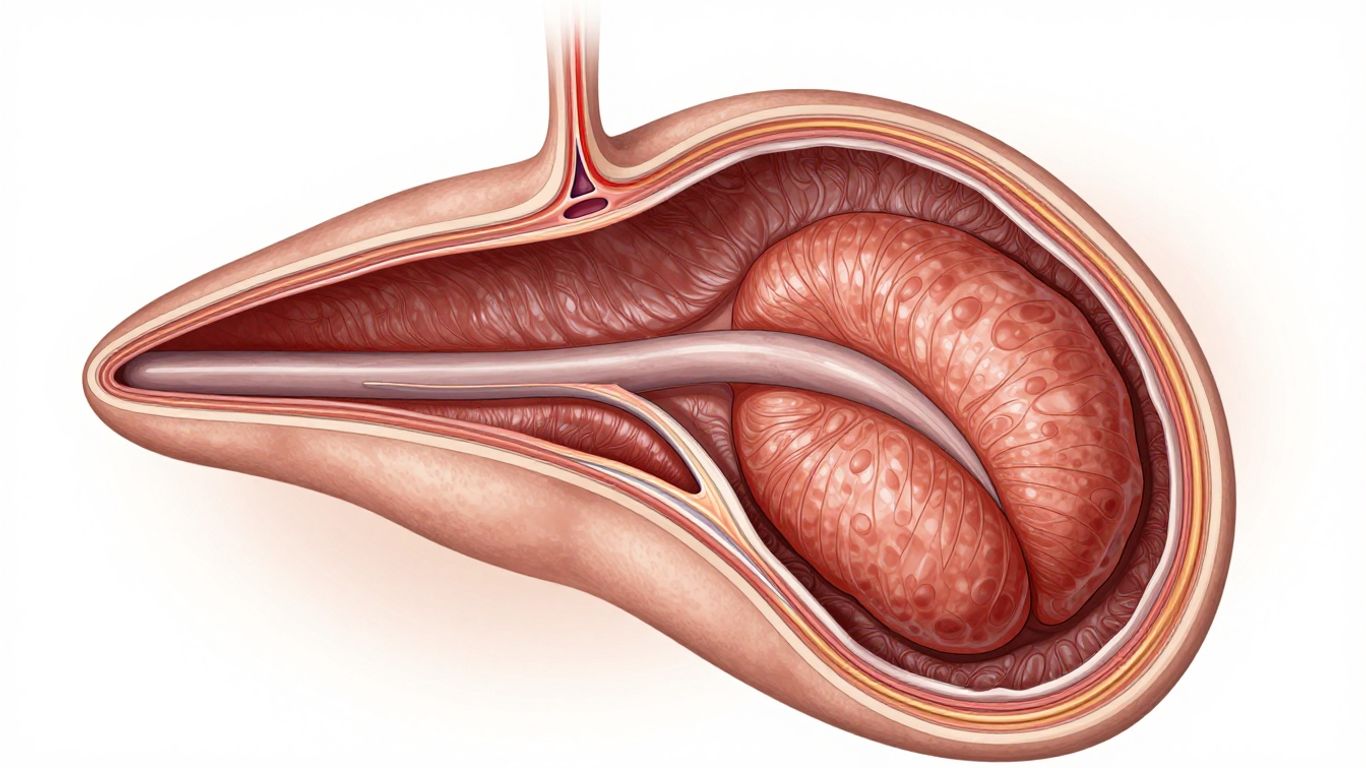
Getting consistent and reliable prostate MRI results really hinges on having solid protocols in place. It’s not just about having the latest scanner; it’s about making sure every scan is done the same way, so we can actually compare apples to apples, whether that’s from one patient to the next or even across different hospitals. This standardization helps cut down on a lot of the guesswork and makes the data we get much more useful.
Acquisition Parameter Standardization
To get good, repeatable images, we need to nail down the specifics of how the scan is performed. This means setting clear guidelines for things like the strength of the magnetic field, the type of radiofrequency pulses used, and how long each sequence runs. Think of it like a recipe – if everyone uses different amounts of ingredients or cooks at different temperatures, the final dish will vary wildly. For prostate imaging, this involves defining:
- Field of View (FOV): How much of the body is included in the image. For prostate scans, we typically want to cover the entire prostate and seminal vesicles, usually around 180-200mm.
- Slice Thickness: The thinness of each individual image slice. Thinner slices (like 3mm) give more detail but take longer to acquire.
- Repetition Time (TR) and Echo Time (TE): These are technical settings that affect how the image contrast looks. Standardizing these helps ensure consistent image quality.
- Matrix Size and Number of Excitations (NEX): These influence image resolution and how much signal averaging is done to reduce noise.
Mitigating Artifacts for Accurate Imaging
Artifacts are basically unwanted signals or distortions in the MRI image that can make it hard to see what’s really going on. They can come from a few different places, like the patient moving, the scanner itself, or even just the way the body works. For prostate imaging, a big culprit is peristalsis – the normal movement of the intestines. This can blur the images, especially around the prostate. To combat this, we often give patients a medication like IV buscopan before the scan. This helps relax the bowel muscles and reduces those annoying movements. Other common artifacts can come from breathing or even blood flow, so using techniques like saturation bands can help suppress those signals too.
The goal here is to create a clean image where the prostate and any abnormalities stand out clearly. Without addressing these potential image corruptions, even the best scanner won’t give us the information we need for accurate diagnosis and measurement.
Planning Sequences for Optimal Coverage
Proper planning of the scan sequences is super important. It’s not enough to just put the patient in the scanner; we need to carefully position the imaging slices to get the best view of the prostate. This usually starts with a quick scout scan (like a HASTE localizer) that shows us the general anatomy in three planes. From there, we can plan the main imaging sequences. For example, when taking sagittal images, we angle the scan block to be parallel to specific anatomical landmarks, like the anal canal. Then, we check this in the other views (axial and coronal) to make sure it’s just right. We need to make sure our slices cover the entire area of interest, from the bottom of the pelvis to the top, and that the field of view is wide enough to capture everything important, including the seminal vesicles. Getting this planning right is key to avoiding gaps in the images and ensuring we capture all the necessary information for accurate volume calculation and assessment.
Interpreting Quantitative Prostate Data
So, you’ve got all these numbers from the MRI scans – what do they actually mean? It’s not just about seeing a spot; it’s about understanding what those numbers tell us about the prostate tissue. This is where quantitative data really shines, moving beyond just a ‘looks suspicious’ kind of assessment.
Comparing MRI to Histopathology
This is a big one. Ideally, we want our MRI findings to line up with what a pathologist sees under the microscope after a biopsy or surgery. Quantitative MRI metrics, like the Apparent Diffusion Coefficient (ADC) values, can be compared to the Gleason score determined from tissue samples. Generally, lower ADC values often correlate with higher-grade cancers. The goal is to get MRI to predict the actual aggressiveness of the cancer as seen in the tissue. It’s like having a pre-biopsy preview, helping doctors decide if and how aggressively to treat.
Predicting Recurrence with Margin Length
After surgery, the surgical margin is checked to see if any cancer cells were left behind. While this is a direct look at the tissue, quantitative MRI can sometimes help predict the risk of recurrence even before it’s clinically obvious. For example, certain quantitative features might indicate a higher likelihood of microscopic cancer being left behind, even if the margin looks clear on initial pathology. This is still an area of active research, but the idea is to use the MRI numbers to get a better sense of the long-term outlook.
Clinical Application of Quantitative Metrics
What does all this mean for actual patient care? Well, it’s about making more informed decisions. Instead of just relying on size and general appearance, doctors can use quantitative data to:
- Characterize lesions: Is this area likely benign or malignant based on its ADC, T2 values, or how it enhances after contrast?
- Assess treatment response: For patients undergoing therapy, quantitative MRI can track changes in tumor characteristics over time, showing if the treatment is working.
- Guide biopsies: Knowing which areas have the most concerning quantitative values can help direct biopsy needles more effectively.
- Stratify risk: Grouping patients based on quantitative data can help tailor follow-up and treatment plans.
The challenge often lies in the variability of these measurements. Different machines, different settings, and even different radiologists can get slightly different numbers. That’s why standardizing protocols is so important. We need to be able to trust that a low ADC value means the same thing whether the scan was done at Hospital A or Hospital B.
Think of it like this: qualitative assessment is like looking at a blurry photo, while quantitative assessment is like having a high-resolution image with precise measurements. The more precise our measurements, the better we can understand and manage prostate conditions.
Wrapping It Up
So, we’ve gone through how to figure out the prostate’s volume. It might seem a bit technical at first, but really, it’s about getting accurate measurements. Whether you’re using standard methods or looking into newer, more detailed approaches like radiomics, the goal is the same: to get the clearest picture possible. Getting these numbers right helps doctors make better decisions, which is what it’s all about. Keep practicing, and don’t be afraid to double-check your work. It makes a difference.
Frequently Asked Questions
Why is measuring the prostate’s size important?
Knowing the prostate’s size helps doctors figure out how likely it is that there’s cancer. It’s one of the first things doctors look at when checking the prostate. A bigger size might mean more issues, but it’s just one piece of the puzzle.
Are there different ways to measure prostate volume?
Yes, there are. Doctors can guess the size based on how it looks on scans (that’s called qualitative). But for more exact information, they use special computer programs and scans that give numbers (quantitative methods). These number-based methods are usually more reliable.
What is ‘Radiomics’ and how does it help?
Radiomics is like using a super-powered magnifying glass on MRI scans. It pulls out tiny details and patterns that the human eye might miss. These details can give doctors more clues about the prostate, like how aggressive cancer might be.
Can MRI scans be wrong about the size?
Sometimes, MRI scans can slightly underestimate the actual size of a tumor compared to what’s found after surgery. However, they are pretty good at predicting if cancer has spread outside the prostate, which is also very important information.
What are ‘Diffusion-Weighted Imaging (DWI)’ and ‘ADC values’?
These are special ways MRI looks at how water moves within the prostate. Cancer cells can make water move differently. By measuring this, doctors can get more information about suspicious areas, helping to tell cancer apart from normal tissue.
Why is it important to have standard MRI rules?
Having standard rules for how MRI scans are done and what pictures are taken helps make sure doctors everywhere get similar, reliable results. It’s like having a recipe that everyone follows so the cake turns out the same every time, no matter who bakes it.
- Best Supplement Bundle for Healthy Digestion and Bloating
- Best Supplement Stack for Daily Inflammation Support
- Best Daily Supplements for Runners Health: What Matters Most
- Best Supplement Stack for Inflammation and Recovery
- Best Wellness Stacks for Active Lifestyles: A Practical Guide
- Best Supplement Stack for Runners Recovery
- Best Marathon Recovery Supplement Stack for Faster Repair
- Magnesium Glycinate Benefits for Women: Sleep, Calm, and Cycle Support
You may also find this Nutrition Geeks guide helpful: 10 Vitamins for Fatigue and Tiredness.
You may also find this Nutrition Geeks guide helpful: Unlocking the Secret: How Does Herbalife Tea Burn Calories?.
You may also find this Nutrition Geeks guide helpful: Unveiling the Benefits: What is Herbalife Aloe Concentrate Good For?.